Description
tuna is a Python profile viewer inspired by the amazing SnakeViz.
Create a runtime profile with
```
python -mcProfile -o program.prof yourfile.py
```
or an import profile with
```
python -X importprofile yourfile.py 2> import.log
```
and show it with
```
tuna program.prof
```
tuna alternatives and similar packages
Based on the "Data Visualization" category.
Alternatively, view tuna alternatives based on common mentions on social networks and blogs.
-
Apache Superset
DISCONTINUED. Apache Superset is a Data Visualization and Data Exploration Platform [Moved to: https://github.com/apache/superset] -
-
redash
Make Your Company Data Driven. Connect to any data source, easily visualize, dashboard and share your data. -
-
plotly
The interactive graphing library for Python :sparkles: This project now includes Plotly Express! -
-
-
-
-
-
#<Sawyer::Resource:0x00007fbd82367850>
Panel: The powerful data exploration & web app framework for Python -
-
-
Flask JSONDash
:snake: :bar_chart: :chart_with_upwards_trend: Build complex dashboards without any front-end code. Use your own endpoints. JSON config only. Ready to go. -
-
-
-
-
ipyvizzu
Build animated charts in Jupyter Notebook and similar environments with a simple Python syntax. -


WorkOS - The modern identity platform for B2B SaaS


* Code Quality Rankings and insights are calculated and provided by Lumnify.
They vary from L1 to L5 with "L5" being the highest.
Do you think we are missing an alternative of tuna or a related project?


README
Performance analysis for Python.


<!--
 -->
-->


![]()
![]()
tuna is a modern, lightweight Python profile viewer inspired by SnakeViz. It handles runtime and import profiles, has minimal dependencies, uses d3 and bootstrap, and avoids certain errors present in SnakeViz (see below) and is faster, too.
Create a runtime profile with
python -mcProfile -o program.prof yourfile.py
or an import profile with
python -X importtime yourfile.py 2> import.log
and show it with
tuna program.prof
Why tuna doesn't show the whole call tree
The whole timed call tree cannot be retrieved from profile data. Python developers made the decision to only store parent data in profiles because it can be computed with little overhead. To illustrate, consider the following program.
import time


def a(t0, t1):
    c(t0)
    d(t1)


def b():
    a(1, 4)


def c(t):
    time.sleep(t)


def d(t):
    time.sleep(t)


if __name__ == "__main__":
    a(4, 1)
    b()
The root process (__main__) calls a() which spends 4 seconds in c() and 1 second
in d(). __main__ also calls b() which calls a(), this time spending 1 second in
c() and 4 seconds in d(). The profile, however, will only store that c() spent a
total of 5 seconds when called from a(), and likewise d(). The information that the
program spent more time in c() when called in root -> a() -> c() than when called in
root -> b() -> a() -> c() is not present in the profile.
tuna only displays the part of the timed call tree that can be deduced from the profile. SnakeViz, on the other hand, tries to construct the entire call tree, but ends up providing lots of wrong timings.
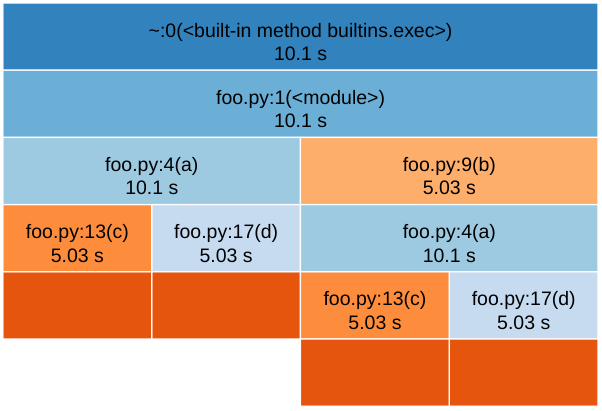 |
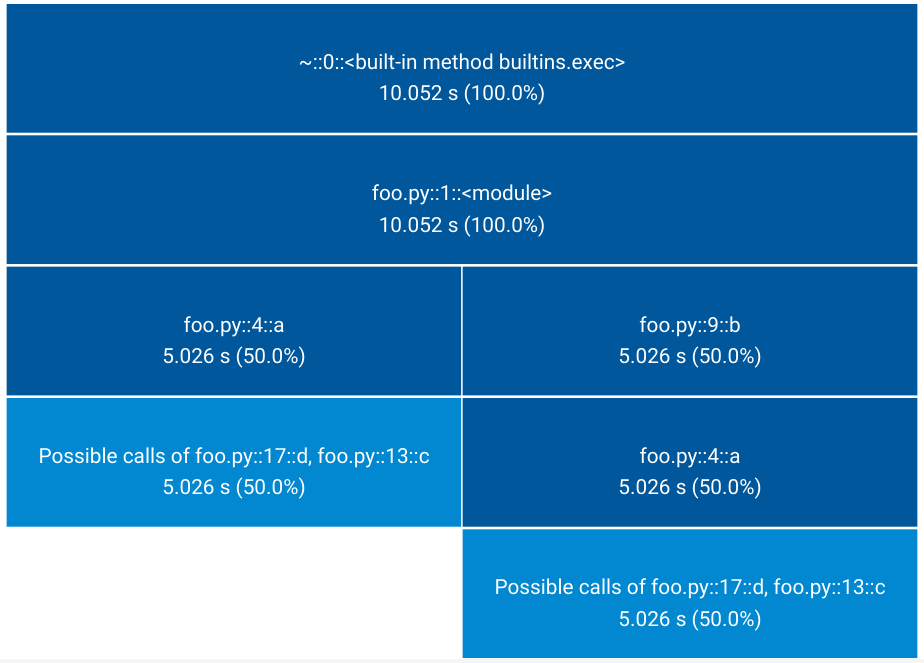 |
|---|---|
| SnakeViz output. Wrong. | tuna output. Only shows what can be retrieved from the profile. |
Installation
tuna is available from the Python Package Index, so simply do
pip install tuna
to install.
Testing
To run the tuna unit tests, check out this repository and type
pytest
IPython magics
tuna includes a tuna line / cell magic which can be used as a drop-in replacement for
the prun magic. Simply run %load_ext tuna to load the magic and then call it like
%tuna sleep(3) or
%%tuna
sleep(3)
prun is still used to do the actual profiling and then the results are displayed in
the notebook.
Development
After forking and cloning the repository, make sure to run make dep to install
additional dependencies (bootstrap and d3) which aren't stored in the repo.
License
This software is published under the GPLv3 license.
*Note that all licence references and agreements mentioned in the tuna README section above
are relevant to that project's source code only.