
diagrams alternatives and similar packages
Based on the "Data Visualization" category.
Alternatively, view diagrams alternatives based on common mentions on social networks and blogs.
-
Apache Superset
DISCONTINUED. Apache Superset is a Data Visualization and Data Exploration Platform [Moved to: https://github.com/apache/superset] -
redash
Make Your Company Data Driven. Connect to any data source, easily visualize, dashboard and share your data. -
-
-
-
-
-
-
-
#<Sawyer::Resource:0x00007fbd82367850>
Panel: The powerful data exploration & web app framework for Python -
-
-
-
-
-
Flask JSONDash
:snake: :bar_chart: :chart_with_upwards_trend: Build complex dashboards without any front-end code. Use your own endpoints. JSON config only. Ready to go. -
-
-
-
-
-
-
-
-
ipyvizzu
Build animated charts in Jupyter Notebook and similar environments with a simple Python syntax. -
-
-
-
-
-


Sevalla - Deploy and host your apps and databases, now with $50 credit!


* Code Quality Rankings and insights are calculated and provided by Lumnify.
They vary from L1 to L5 with "L5" being the highest.
Do you think we are missing an alternative of diagrams or a related project?


README
[diagrams logo](assets/img/diagrams.png)
Diagrams
![]()
![]()
![]()

Diagram as Code.
Diagrams lets you draw the cloud system architecture in Python code. It was born for prototyping a new system architecture design without any design tools. You can also describe or visualize the existing system architecture as well. Diagrams currently supports main major providers including: AWS, Azure, GCP, Kubernetes, Alibaba Cloud, Oracle Cloud etc... It also supports On-Premise nodes, SaaS and major Programming frameworks and languages.
Diagram as Code also allows you to track the architecture diagram changes in any version control system.
NOTE: It does not control any actual cloud resources nor does it generate cloud formation or terraform code. It is just for drawing the cloud system architecture diagrams.
Providers
Getting Started
It requires Python 3.6 or higher, check your Python version first.
It uses Graphviz to render the diagram, so you need to install Graphviz to use diagrams. After installing graphviz (or already have it), install the diagrams.
macOS users can download the Graphviz via
brew install graphvizif you're using Homebrew.
# using pip (pip3)
$ pip install diagrams

# using pipenv
$ pipenv install diagrams

# using poetry
$ poetry add diagrams
You can start with quick start. Check out guides for more details, and you can find all available nodes list in here.
Examples
| Event Processing | Stateful Architecture | Advanced Web Service |
|---|---|---|
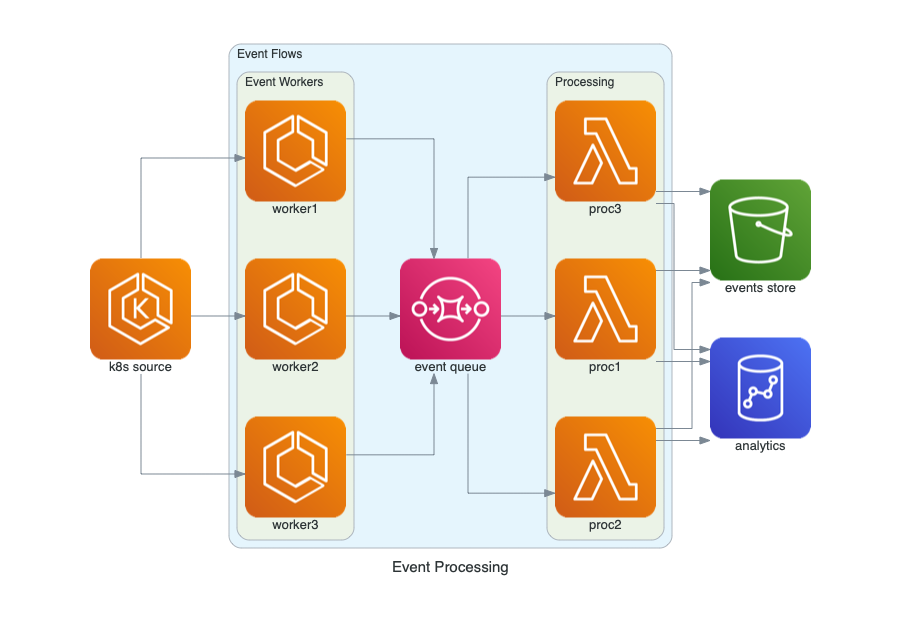 |
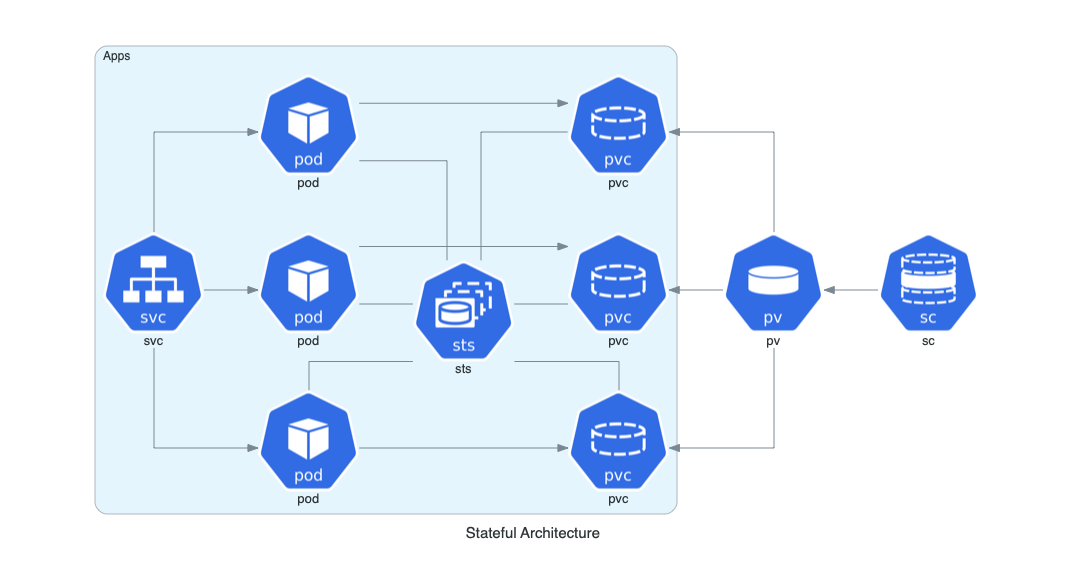 |
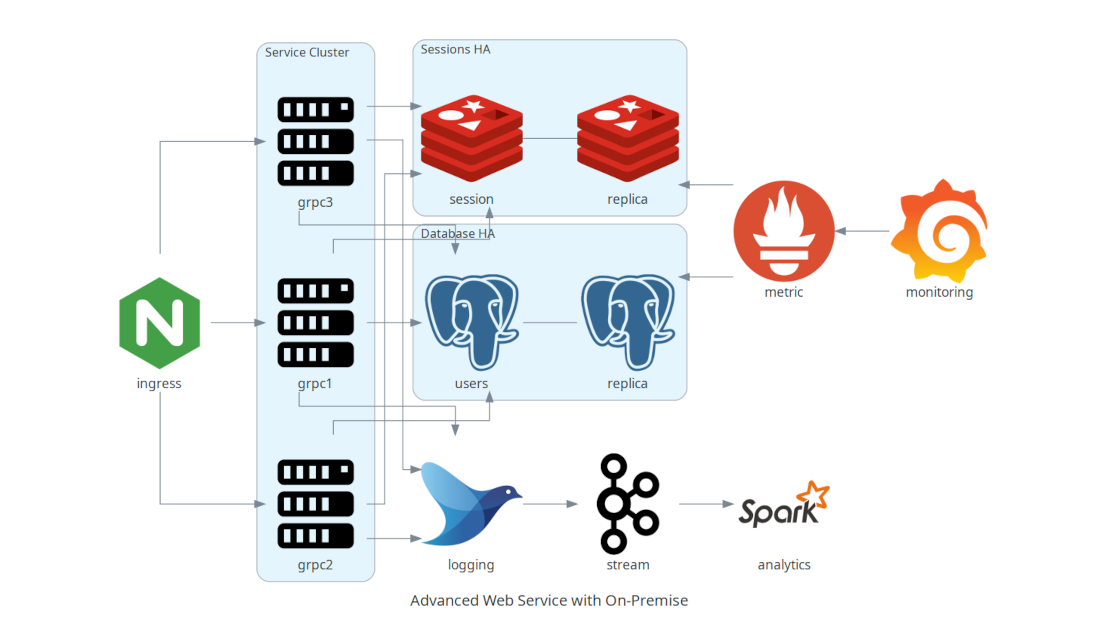 |
You can find all the examples on the examples page.
Contributing
To contribute to diagram, check out [contribution guidelines](CONTRIBUTING.md).
Let me know if you are using diagrams! I'll add you in showcase page. (I'm working on it!) :)
Who uses it?
GitPitch is the perfect slide deck solution for Tech Conferences, Training, Developer Advocates, and Educators. Diagrams is now available as a dedicated Cloud Diagram Markdown Widget so you can use Diagrams directly on any slide for conferences, meetups, and training.
Cloudiscovery helps you to analyze resources in your cloud (AWS/GCP/Azure/Alibaba/IBM) account. It allows you to create a diagram of analyzed cloud resource map based on this Diagrams library, so you can draw your existing cloud infrastructure with Cloudiscovery.
Airflow Diagrams is an Airflow plugin that aims to easily visualise your Airflow DAGs on service level from providers like AWS, GCP, Azure, etc. via diagrams.
Other languages
- If you are familiar with Go, you can use go-diagrams as well.
License
[MIT](LICENSE)
*Note that all licence references and agreements mentioned in the diagrams README section above
are relevant to that project's source code only.